
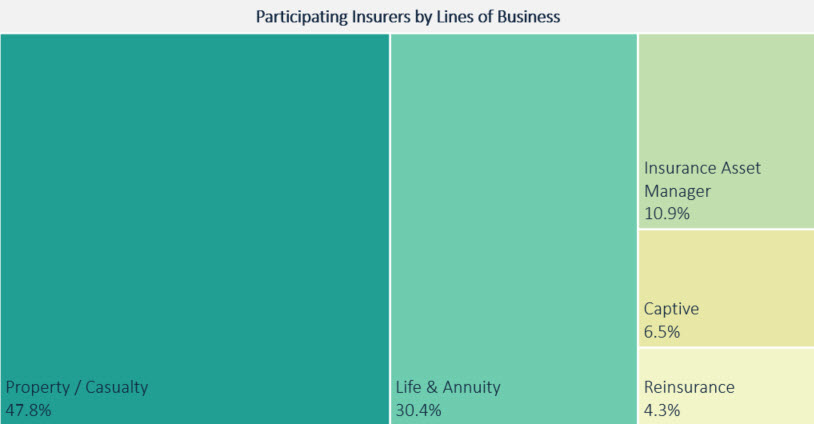
Participating Insurers by Lines of Business
Respondents represented Property & Casualty (47.8%), Life & Annuity (30.8%), Captive (6.5%) and Reinsurers (4.3%.) 10.9 percent of respondents identified as Insurance asset managers.
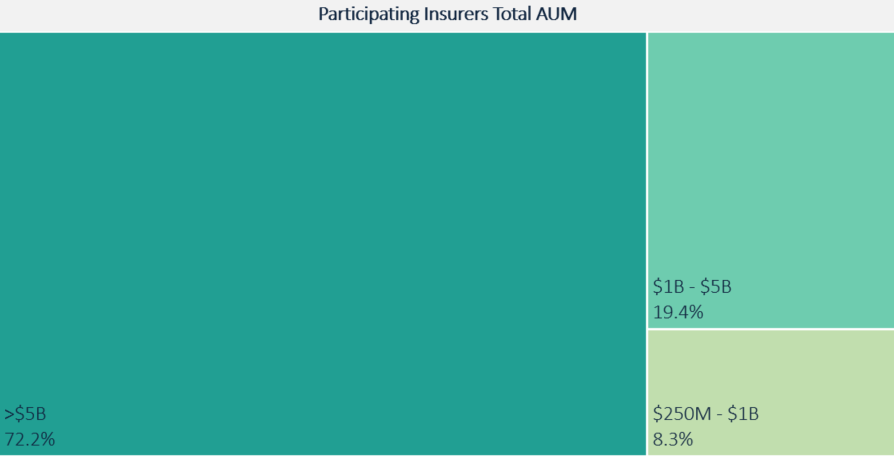
Participating Insurers Total Assets Under Management (AUM)
We asked respondents to indicate approximate AUM. About 74 percent topped $5B AUM. Another 18 percent fell into the $1B-$5B range, and the remainder, about 8 percent, were at $250M - $1B.
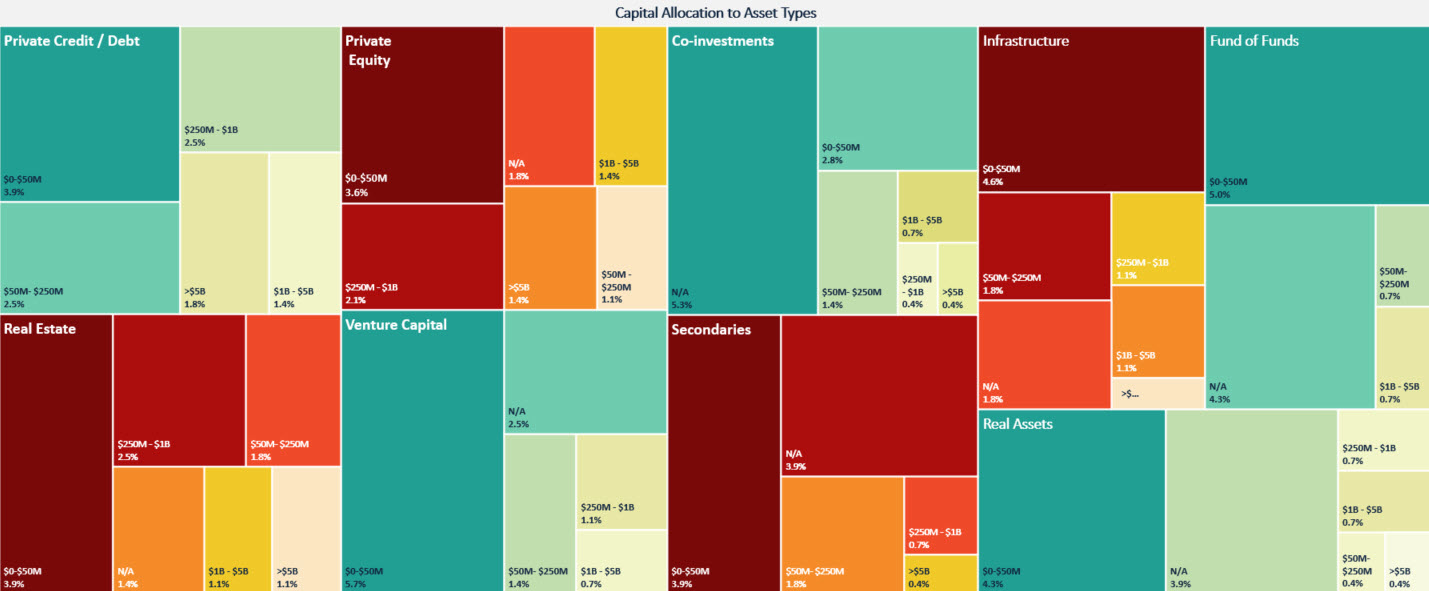
Focusing further on your Schedule BA (Alternative) allocation profile, please indicate the approximate dollar amount of capital you are currently investing in each of the following asset types: private equity, venture capital, real estate, real assets, private credit/debt, fund of funds, secondaries and co-investments.
Nearly half of all respondents are investing $0-50M through venture capital, making it the most prevalent asset type. Private equity and private debt/credit are the asset types most likely to attract $1B+ investments, according to approximately one-quarter of all respondents.
Click image to enlarge
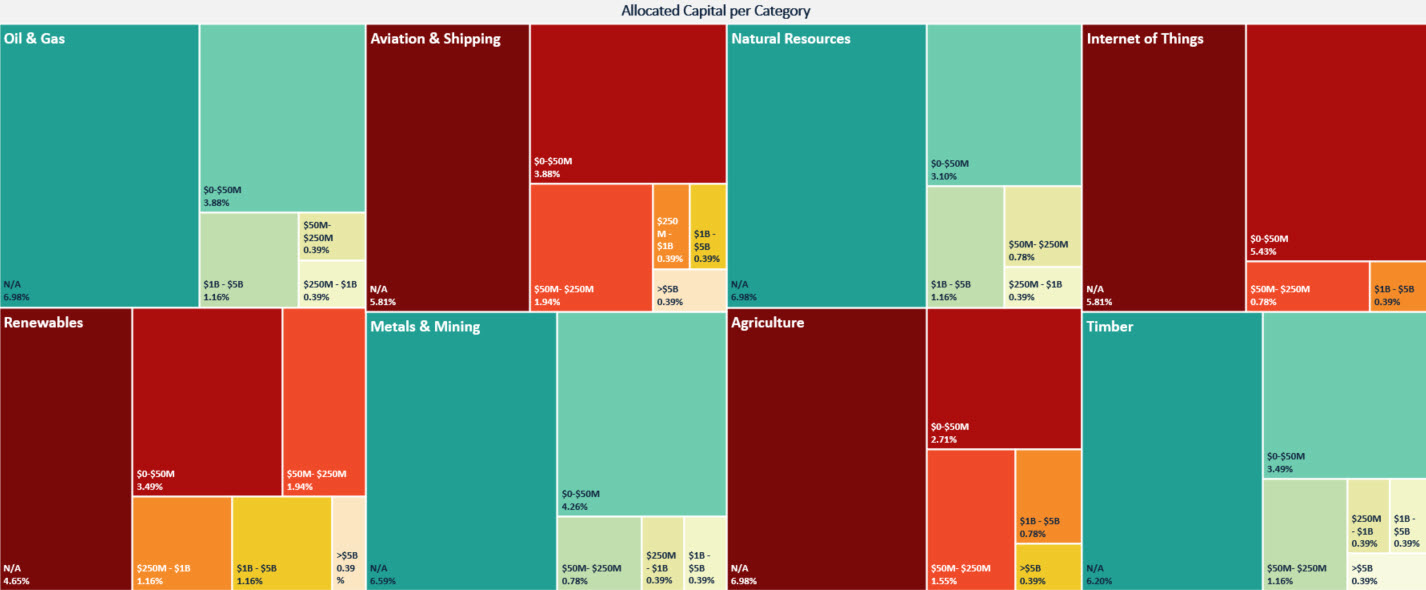
Please indicate the approximate dollar amount of capital you are currently investing for each of the following categories: agriculture, metals and mining, oil and gas, natural resources, timber, renewables, aviation and shipping and Internet of Things (IoT).
Respondents were evenly invested across all categories, but there were notable trends. More than 20 percent indicated they invested at the $0-50M level in each category, while 40 percent indicated they invested at that level in the IoT. Four categories - timber, renewables, aviation and shipping attracted $5B+ investments.
Click the image to enlarge
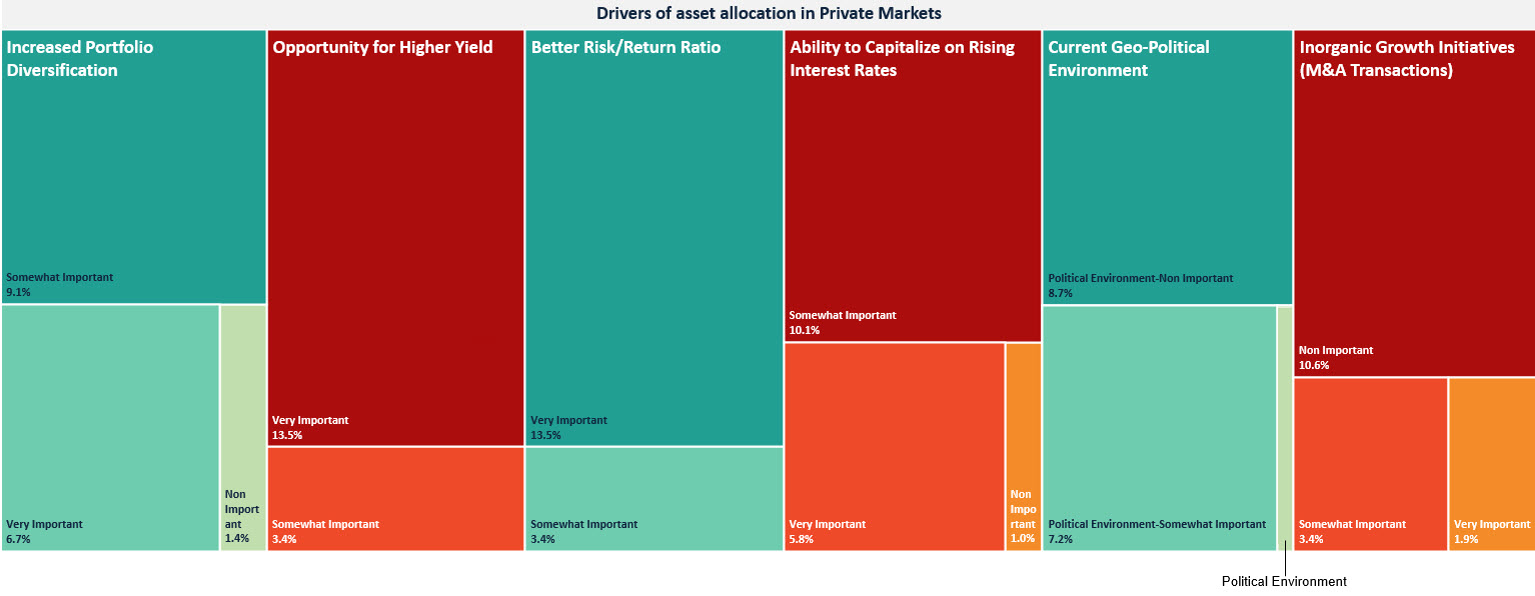
Which of the following would you consider to be drivers of your current asset allocation strategy and investments in private market vehicles: opportunity for higher yield, better risk-return ratio, ability to capitalize on rising interest rates, increased portfolio diversification, current geopolitical situation, and inorganic growth (M&A transactions).
Across all respondents, higher returns and the quest for a better risk/return ratio stood out as critical drivers, with nearly 80 percent of respondents choosing “very important” for each. Inorganic growth was the least important driver, with 66 percent selecting “not important.” However, it is notable that 14 percent considered this factor to be “very important” and 20 percent selected “somewhat important,” indicating that some carriers are highly focused on M&A strategies that may impact private market investing.
Click image to enlarge
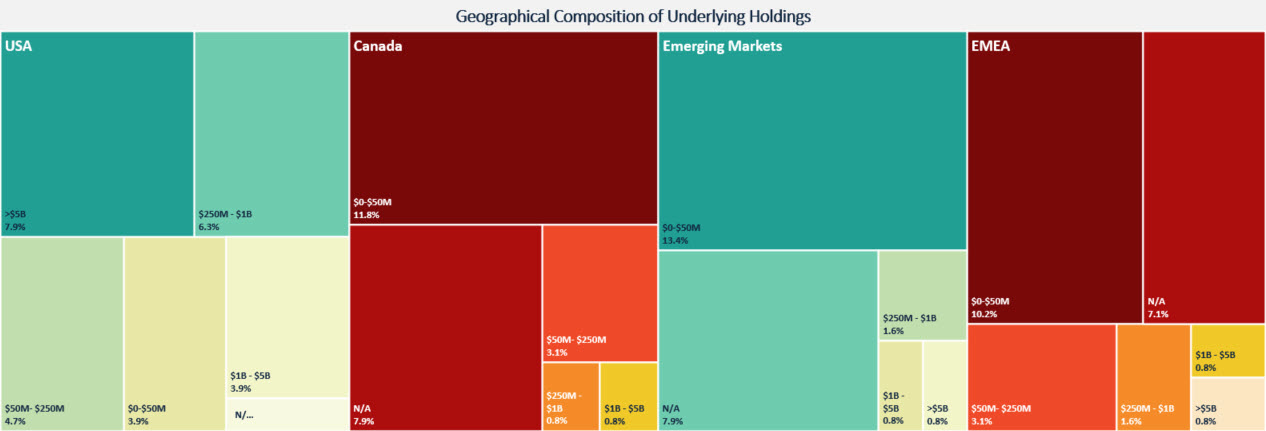
What is the current geographical composition/location of underlying holdings within your Schedule BA (Alternative Investments) assets/holdings? Selections included: USA, Canada, EMEA, and emerging markets.
According to the survey, the USA is receiving the largest number of $250M+ investments and the lowest number of $0-50M investments. Of note, every other region scored high in the $0-50M range, with emerging markets topping the list at 54 percent, indicating that firms are finding worthy opportunities for private market investment everywhere.
Click image to enlarge
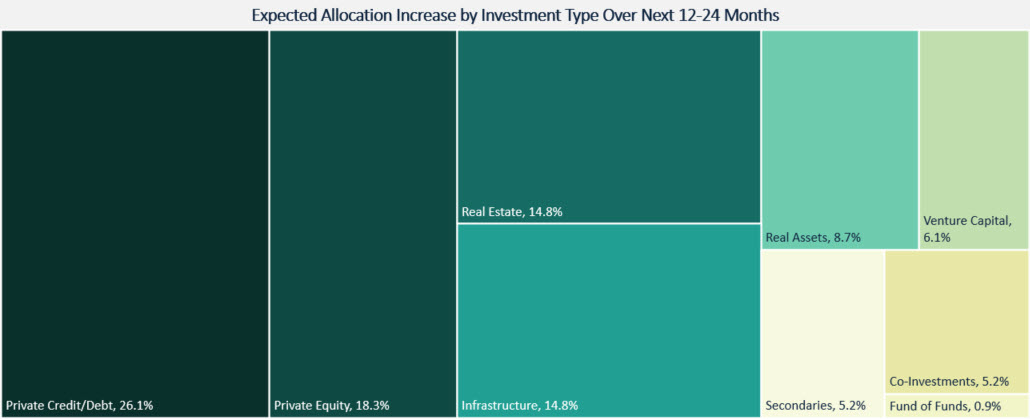
Within your Schedule BA allocation profile, which underlying investment types do you expect to increase allocation/exposure to over the next 12-24 months: private equity, venture capital, real estate, real assets, infrastructure, private credit/debt, fund of funds, secondaries and co-investments.
Private credit/debt and private equity top the list of categories likely to receive increases in the near future. Interestingly, these are also the categories where firms are most likely to have existing $5B+ investments. Of note, 22 percent of respondents indicated planned increases in infrastructure and real estate. Today, 40 percent of respondents currently have ≤$50M invested in these two categories.
Click image to enlarge